
Global Waste Index is intended for public dissemination, and we encourage its sharing across all media channels.
Comprehensive analysis ranks 38 member states of the Organisation for Economic Co-operation and Development (OECD) according to how effectively they manage their waste.
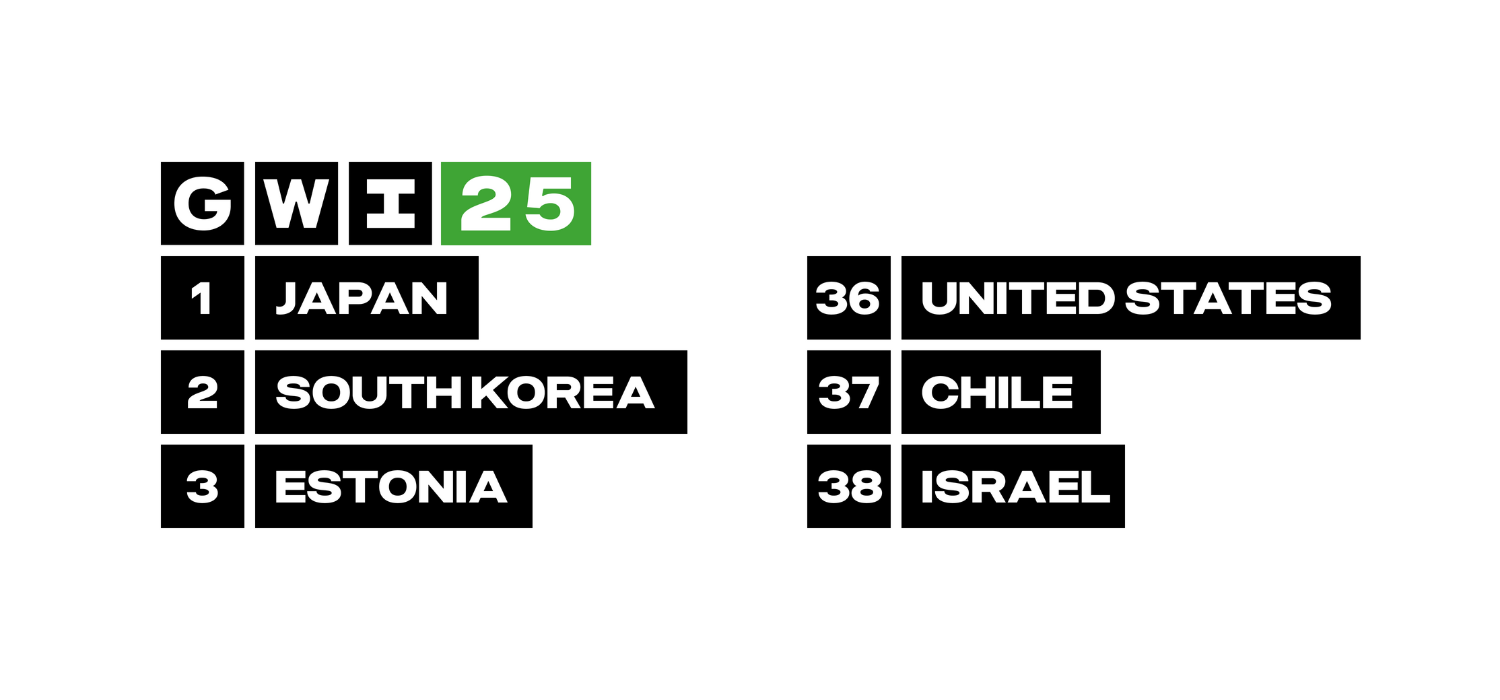
- Israel and Chile emerged as the two largest waste producers in the world.
- The United States increased its output from 811 to 951 kilograms per capita per year, remaining the country that generates the most municipal solid waste.
- The United Kingdom managed to decrease its incineration rate by approximately 74% — from 190 kg to 50 kg per year.
- Estonia joined the top three countries with the best waste management practices, alongside two Asian countries Japan and South Korea.
The Global Waste Index 2025 created by Sensoneo, a leader in the digital transformation of waste management operating in 87 countries worldwide, reveals that significant differences remain in the amount of waste generated globally and in how it is disposed of. The Global Waste Index 2025 analyzes the waste management efficiency of 38 countries and ranks the world's largest waste polluters. The study was first conducted in 2019 and followed by the 2022 edition.
Table: The world’s biggest waste polluters, showing per capita amounts of total waste generated, recycled, incinerated, and landfilled in a year. All values represent kilograms per capita per year.
The Global Waste Index 2025 evaluates waste management efficiency and ranks countries in descending order, starting with those performing the worst. This comparative analysis is based on the most recent data available in each country. For the full methodology and the complete ranking of all 38 countries, please visit the Sensoneo website.
| Rank | Rank 2022 | Country | Waste Generated | Recycling | Incineration | Landfill | Recycled / Generated | Final score |
| 38 | ↙ 33 | Israel | 650 | 49 | 9 | 524 | 8% | 0.0 |
| 37 | ↙ 36 | Chile | 437 | 2 | 1 | 417 | 0% | 22.1 |
| 36 | ↙ 25 | United States | 951 | 284 | 127 | 447 | 30% | 28.7 |
| 35 | ↙ 28 | Greece | 519 | 82 | 8 | 420 | 16% | 29.0 |
| 34 | ↙ 31 | Canada | 694 | 192 | 34 | 468 | 28% | 30.3 |
| 33 | ↙ 19 | Australia | 543 | 100 | 64 | 286 | 18% | 42.9 |
| 32 | ↗ 38 | Turkey | 380 | 49 | 0 | 330 | 13% | 43.5 |
| 31 | ↗ 35 | Mexico | 359 | 13 | 0 | 219 | 4% | 43.6 |
| 30 | ↙ 24 | Portugal | 505 | 66 | 92 | 285 | 13% | 44.4 |
| 29 | ↗ 30 | Iceland | 595 | 123 | 93 | 196 | 21% | 48.7 |
| 28 | ↗ 29 | New Zealand | 608 | 213 | 0 | 304 | 35% | 49.2 |
| 27 | ↙ 23 | Spain | 465 | 96 | 49 | 223 | 21% | 53.3 |
| 26 | ↔ 26 | Costa Rica | 325 | 42 | 10 | 255 | 13% | 53.9 |
| 25 | ↙ 15 | Hungary | 429 | 83 | 53 | 233 | 19% | 55.4 |
| 24 | ↙ 20 | Czechia | 570 | 175 | 69 | 263 | 31% | 56.9 |
| 23 | ↙ 22 | Colombia | 243 | 19 | 0 | 214 | 8% | 60.5 |
| 22 | ↗ 37 | Latvia | 464 | 157 | 14 | 202 | 34% | 62.8 |
| 21 | ↗ 27 | Slovakia | 472 | 154 | 36 | 183 | 33% | 64.8 |
| 20 | ↙ 13 | Poland | 367 | 58 | 76 | 111 | 16% | 66.8 |
| 19 | ↙ 14 | France | 530 | 120 | 161 | 121 | 23% | 68.8 |
| 18 | ↔ 18 | United Kingdom | 436 | 114 | 50 | 40 | 26% | 69.3 |
| 17 | ↗ 34 | Italy | 486 | 141 | 90 | 88 | 29% | 71.4 |
| 16 | ↙ 2 | Denmark | 802 | 187 | 364 | 12 | 23% | 78.1 |
| 15 | ↙ 12 | Ireland | 623 | 161 | 268 | 93 | 26% | 80.3 |
| 14 | ↗ 16 | Lithuania | 446 | 110 | 180 | 35 | 25% | 84.2 |
| 13 | ↗ 22 | Slovenia | 517 | 231 | 69 | 49 | 45% | 85.5 |
| 12 | ↙ 8 | Netherlands | 468 | 129 | 188 | 7 | 28% | 87.6 |
| 11 | ↙ 10 | Luxembourg | 712 | 224 | 291 | 21 | 31% | 88.1 |
| 10 | ↙ 4 | Switzerland | 677 | 193 | 324 | 0 | 29% | 91.3 |
| 9 | ↙ 6 | Norway | 724 | 227 | 339 | 39 | 31% | 92.5 |
| 8 | ↗ 9 | Sweden | 392 | 79 | 230 | 4 | 20% | 92.6 |
| 7 | ↗ 11 | Belgium | 689 | 232 | 310 | 1 | 34% | 96.2 |
| 6 | ↙ 5 | Finland | 468 | 135 | 256 | 2 | 29% | 97.9 |
| 5 | ↗ 17 | Austria | 803 | 334 | 284 | 17 | 42% | 98.6 |
| 4 | ↙ 3 | Germany | 601 | 270 | 184 | 7 | 45% | 99.4 |
| 3 | ↗ 32 | Estonia | 373 | 142 | 159 | 2 | 38% | 99.5 |
| 2 | ↙ 1 | South Korea | 438 | 236 | 91 | 56 | 54% | 99.6 |
| 1 | ↗ 7 | Japan | 326 | 63 | 245 | 3 | 19% | 100.0 |
Alarming landfilling rates in North America
As in 2022, the country generating the most municipal solid waste remains unchanged: the United States has even increased its output from 811 kilograms to 951 kilograms per capita. Along with its neighbour Canada, both North American nations rank at the bottom in terms of waste management, with alarming rates of landfill disposal. The United States sends 447 kg of its 951 kg of waste per capita to landfills, while Canada has an even higher proportion: 67% out of 684 kg of all generated waste ends up in landfills.
Waste generation varies widely across U.S. states
California, the most populous state, tops the ranking with 1,781 kg of waste per capita. Florida follows closely with 1,511 kg, making both states the most wasteful. In contrast, states like Alaska and Rhode Island generate less than a quarter of that amount. The five least wasteful states are mostly in the Northeast and Midwest. These contrasts reflect differences in local policies, infrastructure, and public engagement in waste reduction.
Other findings of the Global Waste Index 2025:
- Austria recycles the highest amount of municipal waste, at 334 kilograms per capita, which represents 42%, even before the introduction of a national deposit return scheme.
- In Israel, 524 kg out of 650 kg of generated waste is sent to landfills and disposed of in a particularly environmentally harmful way — the highest amount among all countries analyzed.
- Three countries with the largest decreases in the amount of waste generated compared to the previous edition of the ranking were New Zealand (173 kg), Finland (128 kg) and Iceland (107 kg).
- From an environmental perspective, waste incineration is preferable to landfilling. However, in 12 out of 38 countries, more than 50% of generated waste still ends up in landfills — including in countries like Canada, New Zealand, and Australia.
- Switzerland is the only country that does not send any waste to landfill. Other countries with minimal landfill disposal include Belgium (1 kg), Finland and Estonia (2 kg) and Japan (3 kg).
Sensoneo is a global technology company providing data-driven solutions for waste management. Through the integration of innovative technology, Sensoneo enables cities, businesses, and countries to digitally transform their performance, optimize waste collection processes, and lower their environmental footprint. With its team of 150+ professionals, Sensoneo provides complex software and hardware solutions worldwide, with an active presence in Europe, USA, and the MENA region. Sensoneo’s smart waste management solutions have garnered attention from countries, cities, and businesses worldwide, with installations in over 87 countries across five continents.
As the only company worldwide, Sensoneo has successfully implemented and operates IT systems for Deposit Return Schemes (DRS) in 9 countries, achieving recycling performance exceeding 90%. The deployment of smart sensors by Sensoneo is poised to contribute to the largest smart waste installation worldwide, encompassing an impressive 11,100 sensors in Madrid. Additionally, Sensoneo has designed tools to automate factory waste collection, enabling its customers to improve waste diversion rates and data reporting at their locations.