When EJScreen went dark in early 2025, the U.S. EPA ended access to datasets that everyday people and companies — including the waste industry — used for tracking the impacts of pollution on overburdened communities. But former EPA officials are working with academics, researchers and community activists to develop more advanced and more detailed mapping tools.
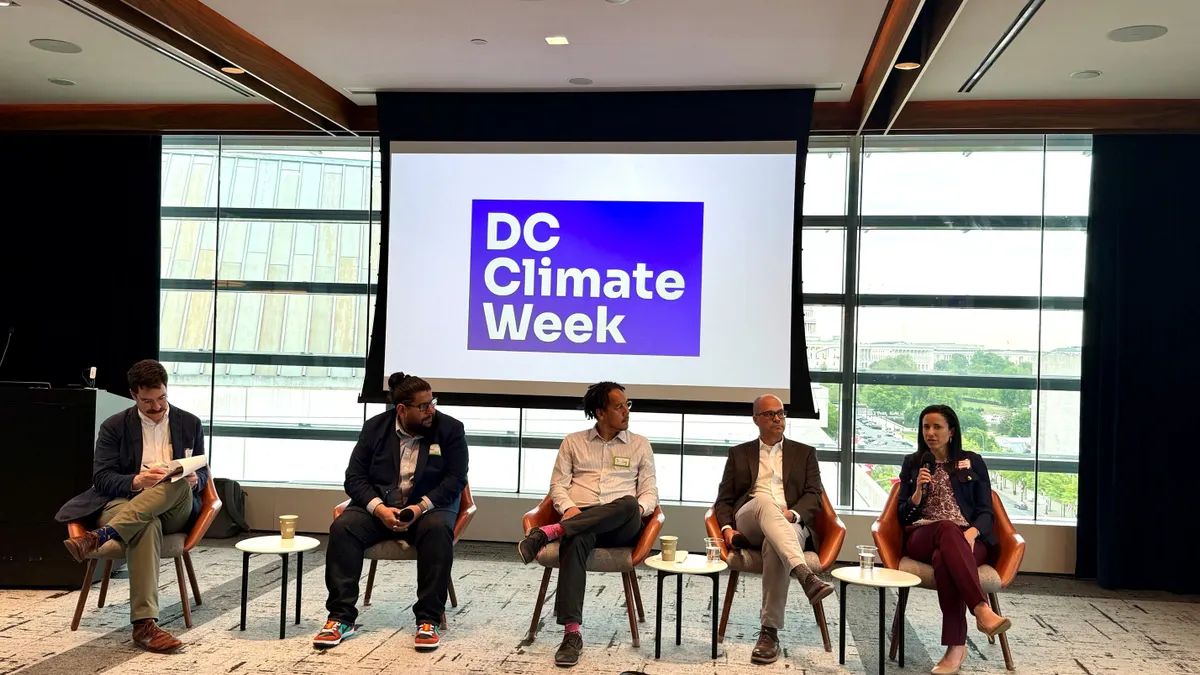
At a DC Climate Week discussion on Wednesday, speakers highlighted how independent screening tools can inform future environmental policies and help communities advocate for themselves through data, especially as the U.S. EPA now actively discourages environmental justice initiatives.
“We have this great opportunity to start from scratch, to take what we have done and use that as a base but to go much, much further,” said Tai Lung, a former EPA employee and one of EJScreen’s developers. He now co-leads Environmental & Health Data Analysis Trust, a group formed to create new environmental screening platforms.
EJScreen’s original impact and role
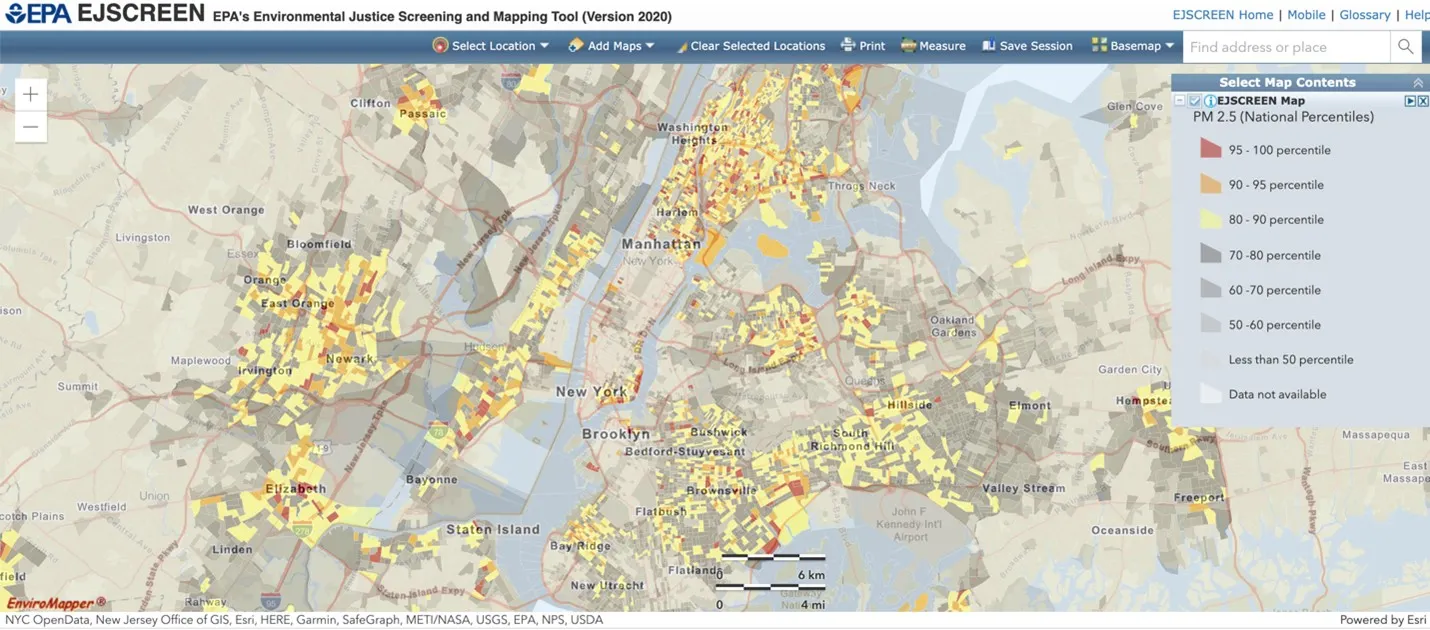
EPA launched EJScreen for the public in 2015. It mapped socioeconomic, climate and health data to show how specific areas face disproportionately higher environmental burdens related to climate, poverty and pollution.
In the past, the waste industry had used EJScreen to help gather data meant to measure sustainability metrics, and some regulators also used the tool to help determine permitting decisions. Other researchers, like Peter DeCarlo, a Johns Hopkins professor who leads a hazardous air pollutant mapping project, said his team used EJScreen to determine the neighborhoods where they focused their monitoring and measurements.
The U.S. EPA shut down EJScreen and other EJ-related programs throughout the first few months of 2025 after President Donald Trump took office. His administration has a large directive to end EJ-related programs, reversing years of environmental justice investments and initiatives led by the Biden administration.
With the end of EJScreen, numerous EPA employees who worked on the tool and related projects were put on administrative leave or ultimately laid off from the agency.
Though EJScreen is gone, it’s not the only tool available. States like Maryland, Massachusetts, California and New Jersey have developed state-level environmental justice mapping tools, and several of these states have laws related to how industries like the waste industry must consider pollution in overburdened communities when applying for certain permits or projects.
But the loss of EJScreen has put Americans at risk, especially those already facing heavy environmental burdens, said Sam Kay, also an EHDAT co-lead and former EPA employee. “We knew that this would have serious consequences, both immediate and long term, for the public,” he said. “We knew how many state, tribal, territorial and local agencies — how many communities, how many researchers and others — put that data and put that tool to work every day to advance health-protective outcomes,” he said.
The end of EJScreen has changed the way some waste companies report their community environmental impacts. For example, Republic Services used to report EJScreen data in its sustainability reports. Republic Services last used EJScreen data in its 2023 sustainability report to describe how its facilities were distributed among neighborhoods where a significant number of people of color live, as well as neighborhoods considered to be low-income. That information was not included for the 2024 report.
Waste Connections included similar EJScreen data in its 2024 sustainability report, but it has not yet published a fully updated sustainability report since EJScreen went offline.
WM, which usually did not include EJScreen data in its sustainability reports but has posted that information online, still has environmental justice data from 2024 on its website. It notes that this data is informed by the “former” EJScreen tool.
The waste industry was just one of numerous entities that used EJScreen for environmental data and insight. In the weeks following the shutdown, some independent groups rushed to launch unofficial reconstructions of the tool, restoring partial access to data. A reproduction of EJScreen, run by Public Enviromental Data Partners, is still active.
EHDAT and other groups are now building off that work to create future tools meant to be more dynamic, interactive and open to important data sources such as citizen science groups, independent researchers and frontline communities.
Even during its heyday, EJScreen had room for growth, Lung said. It was designed as a national-level tool, meaning it didn’t always offer the most granular or detailed information for specific communities. And the platform was running on a model created more than 10 years ago, making it hard to adopt user-friendly updates.
“One of the things that I really hope that we can do moving forward is kind of decentralize the model and build these tools in a way that everybody can use them for different portions of their work,” he said. “If Houston wants to build a tool to look at their water, they don't have to start from scratch.”
EJScreen has also historically been a tool for members of the public and grassroots environmental groups, who can use data from the tool to push back against facility expansions plans and raise awareness of environmental issues in their neighborhoods, said Manny Salgado, federal research manager for We Act for Environmental Justice. But EJScreen had limits there, too.
“There is no perfect screening tool ... that will just apply to the entire nation. The perfect screening tool is a screening tool that gets the results that accurately represent what the community is experiencing on the ground,” he said.
Creating the mapping tools of the future
Future screening tools have the opportunity to do a better job of offering more location-specific data, which will offer more insight than national-level stats, Salgado said.
Some communities that use national income data might appear to be affluent on national maps. That could mean users would miss key insight into overburdened communities that are economically disadvantaged but don’t fall below national poverty thresholds, he said.
“Looking at frontline communities in places like San Francisco, New York City or Seattle, then there are places in those communities that face incredible levels of environmental burden. … But by the nature of being within a city that has a higher cost of living, your income levels are higher when you're compared to, say, a place like rural Mississippi,” he said.
Speakers also envisioned designing mapping tools that have space for frontline communities to explain their experiences in their own words.
Salgado said his wishlist includes tools that “incorporate lived experiences of communities [and] thinking about how to include other data that’s not quantifiable,” he said. That might look like an interactive map that offers both data and pop-up screens with stories from community members who live in a specific region, for example. “You can't take someone's life and turn it into a number.”
Speakers stressed that any new EJ mapping tools will need to be able to inform policy and action. A big part of that is making a tool that users trust. Susan Anenberg, a former EPA employee who now is director of George Washington University’s Climate and Health Institute, said EJScreen had a high level of trust because of its transparency and rigorous standards for validating data. Without that standard, new tools won’t be effective and won’t earn buy-in from the communities that most need them for advocacy, she said.
Encouraging the use and validation of new types of data — and being transparent about where the data comes from — is another element of that trust-building, speakers said. These numerous data streams also help build a platform that is less vulnerable to being struck down amid changing federal political influences, she said.